

This is scary. (How Can Our Kids Accept Diversity If These Books Are What We Use To Raise Them? http://t.co/n8dGuNieWR)
Get Started for FREE
Sign up with Facebook Sign up with X
I don't have a Facebook or a X account

| Tags |
|---|

 Your new post is loading...
 Your new post is loading...
Your new post is loading...
This is scary. (How Can Our Kids Accept Diversity If These Books Are What We Use To Raise Them? http://t.co/n8dGuNieWR) No comment yet.
Sign up to comment
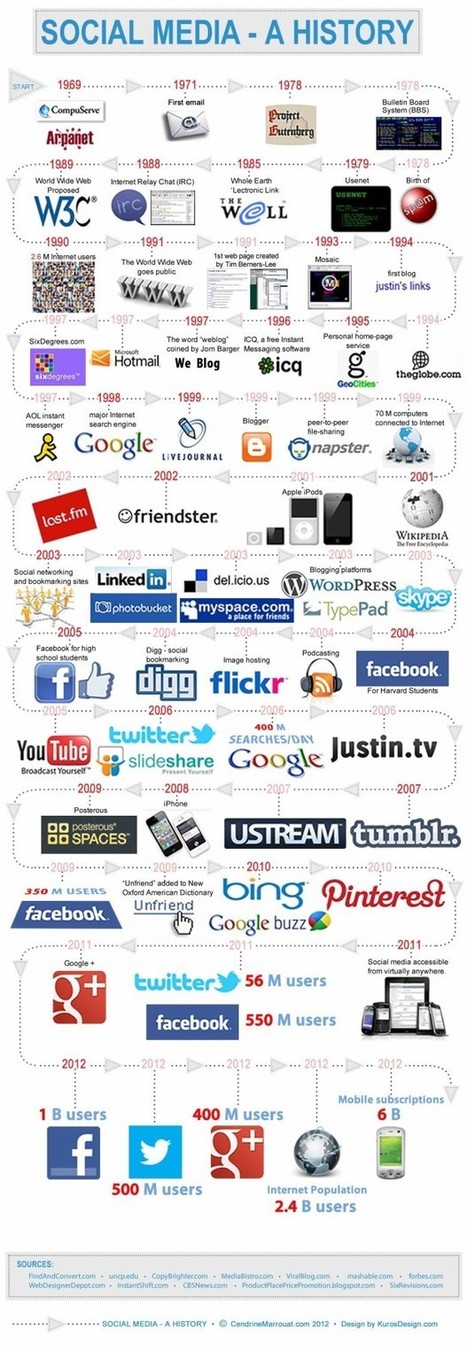
Do you know the history of social media? Think we'll remember Facebook in 20 years? This detailed timeline is a must-see.
Social media began decades before the Facebook era. It started, more or less, with CompuServe and Arpanet back in 1969. A couple years later, the first-ever email was sent. It has evolved over the past few decades into a powerful tool, as seen in this social media history timeline. With so much that’s happened over the past few decades, we can only guess what’s coming next for social media. Via Lauren Moss, Dennis Swender 
Charles Rein's comment,
July 24, 2013 3:38 PM
From the land of "Wired Telephones" USA, we can now look at how explosive Global growth and the potential 5-7 billion people who will always use a Smart or Cell device
![This Is What Happens In Social Media In A Day In 2013 [Infographic] | ED 262 KCKCC Sp '24 | Scoop.it](https://img.scoop.it/V2dK_uW4vBP83ThMfMSgazl72eJkfbmt4t8yenImKBVvK0kTmF0xjctABnaLJIm9)
The progression of social networking has created some mind blowing statistics and metrics when it comes to what goes on within social media in a day. This infographic, Social Media In A Day, contains statistics and metrics from 10 different popular social networking services, presented in a way that makes it easy to grab key statistics. For example, on Facebook alone there are 2.7 billion (yes, billion) likes each day... Via Lauren Moss 
Laura Tate's curator insight,
July 10, 2013 8:25 PM
This is why it is crucial for every business to have a presence on the Web, and a strong social media marketing strategy. Take a look at some of the mind-boggling numbers on this chart. 
Michelle Gilstrap's curator insight,
July 14, 2013 12:59 PM
Very interesting stats regarding social media. Business Owners who are not using social media, need to get into the action |

Do the new digital devices make us smarter or stupider than before?
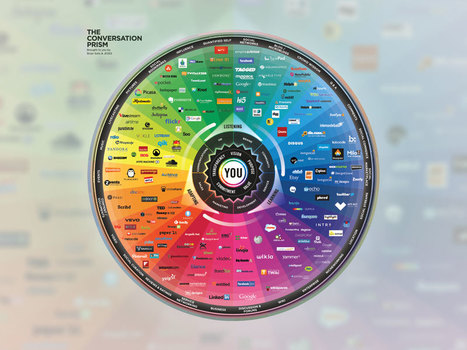
When Brian Solis introduced the first Conversation Prism in 2008, the world was a seemingly simpler place. There were 22 social media categories, each of which had just a handful of brands. Flash forward to 2013, and the latest Conversation Prism has four additional categories with at least six brands in each. Like other Conversation Prisms, the data visualization attempts to illustrate the array of social media choices available to marketers. While the 2008 chart looked like a flower, the latest one resembles a kaleidoscope. Solis, a prominent social media marketing expert, says redoing the chart this time around has been instructive. "Things are changing so fast," he says. "We don't even realize [the landscape] is shifting."
The chart also points out that, for many, membership in the social media ecosystem is fleeting. While some brands like Xanga, Kyte and Utterz have disappeared, others that weren't around five years ago — like Path and Banjo — are now among category leaders. Via The Digital Rocking Chair, Lauren Moss 
Barbara Orlandi's curator insight,
July 4, 2013 10:25 AM
Huge amount of info, sharing, likes, etc... it makes you thinking a lot 
Ryan Burwell's curator insight,
July 8, 2013 1:38 PM
We have so many ways of communicating, Brian Solis had to design a novel way of expressing all the ways we can express ourselves! 
Lee Tonitto's curator insight,
July 19, 2013 9:53 AM
If you need the scoial media landscape in 1 chart here it is
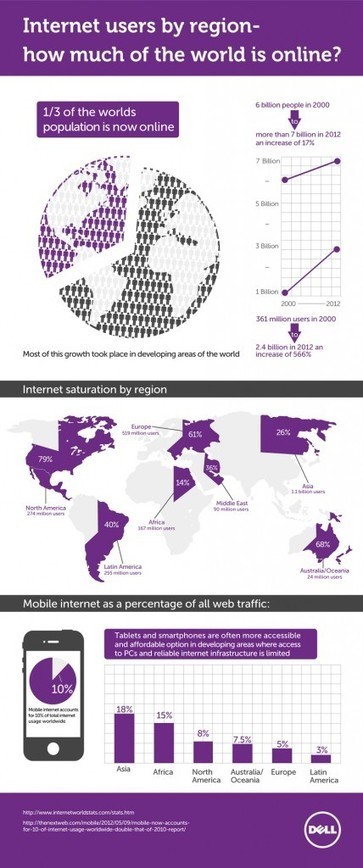
A showcase of the best infographics from around the web (Internet Users By Region – How Much Of The World Is Online?
A look at the current statistics of worldwide internet usage. Via Lauren Moss 
God Is.'s comment July 11, 2013 5:05 PM
Interesting facts. Thanks for sharing them with us...
|