
|
Rescooped by Yves Carmeille "Libre passeur" from iGeneration - 21st Century Education (Pedagogy & Digital Innovation) |


No comment yet.
Sign up to comment
Get Started for FREE
Sign up with Facebook Sign up with X
I don't have a Facebook or a X account


 Your new post is loading...
 Your new post is loading...
Your new post is loading...
No comment yet.
Sign up to comment
A new report from a company called Clutch suggests the pulse of infographics -- at the heart of many content marketing strategies -- is weakening. Via Jeff Domansky, massimo facchinetti

Jeff Domansky's curator insight,
April 3, 2017 6:08 PM
So are infographics dying? Depends on how well you do them.
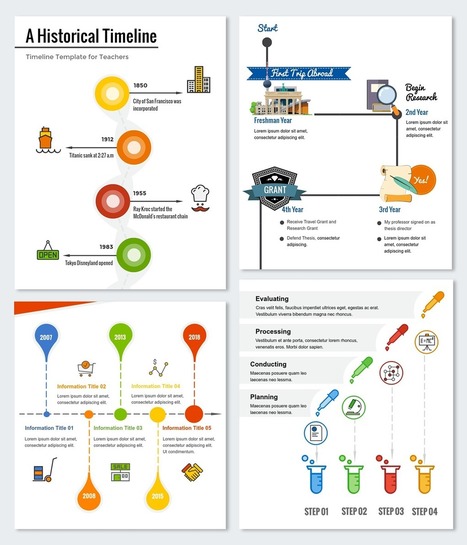
As a foreign language teacher, I am always looking for innovative ways to allow my students to demonstrate what they have learned.

Simon J Condon's curator insight,
December 2, 2016 2:54 PM
Students can use to show historical developmentioned in subjects
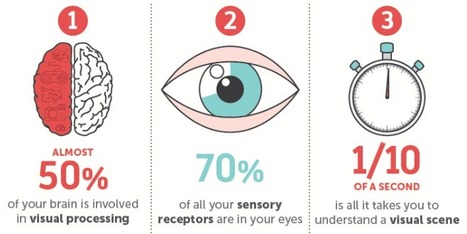
Think back to your first memory: Can you still see the watermelon pink dress you wore? Do you remember the unique checkered pattern of your father's jacket?
Via Jeff Domansky
Jeff Domansky's curator insight,
June 5, 2016 11:51 PM
Here's why our brains crave infographics... in an infographic.
Jeff Domansky's curator insight,
June 6, 2016 12:00 AM
Here's why our brains crave infographics... in an infographic.
![The Complete Visual Guide To Technology For Children [Infographic] | KILUVU | Scoop.it](https://img.scoop.it/VACeOq2pQXj-ld6-oGZImjl72eJkfbmt4t8yenImKBVvK0kTmF0xjctABnaLJIm9)
This handy visual guide explores technology use by young children. How much and what do they use, and is it appropriate? Via Gust MEES

AnnC's curator insight,
October 13, 2013 7:37 PM
Lots of great information addressing access to and use of technology by children! |
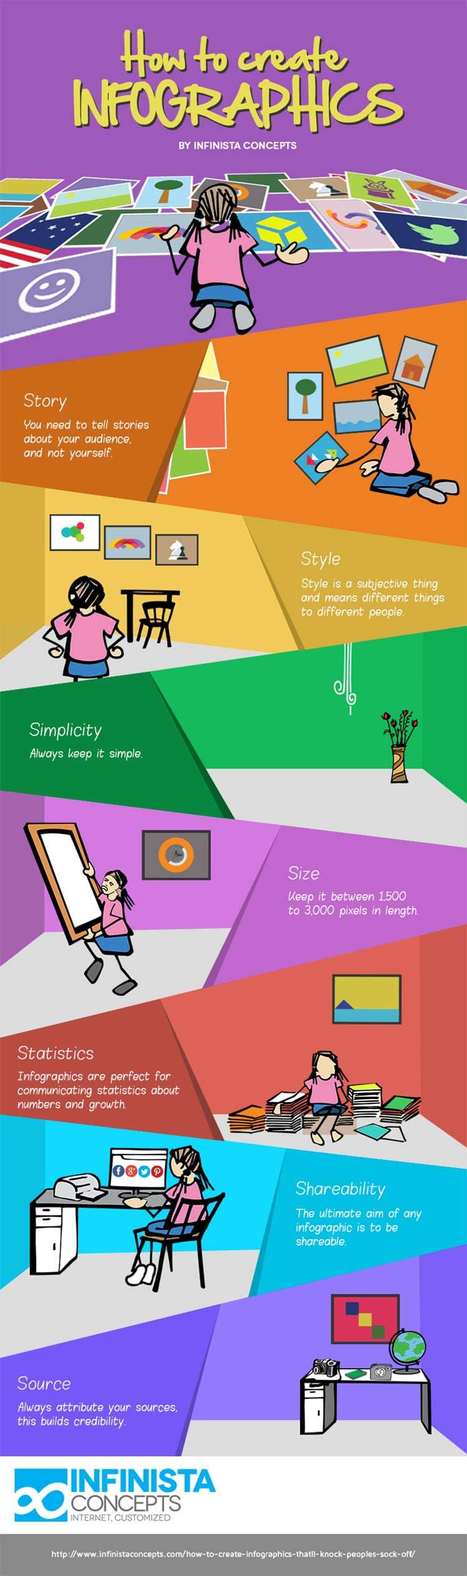
Over the last 5 years, the popularity of infographics in marketing has continued to climb. Thinking of creating one? Read these helpful tips Via janlgordon

janlgordon's curator insight,
April 5, 2017 3:46 PM
I selected this article from Curatti written by Susan Gilbert because it helps you improve your visual marketing with shareable infographics.
Visual graphics can be both fun and informative for your niche audience.
Create Infographics That Grow Your Following Online
People are drawn to appealing content that grabs their attention right away. I agree that infographics can help attract more subscribers and followers.
Gilbert shows you how to create graphics that audiences are more willing to share.
Here's what caught my attention:
Selected by Jan Gordon for Curatti covering Curation, Social Business and Beyond
Featured image: 123rf.
Read full article here: http://ow.ly/x9eO30aBqyw
Stay informed on trends, insights, what's happening in the digital world become a Curatti Insider today
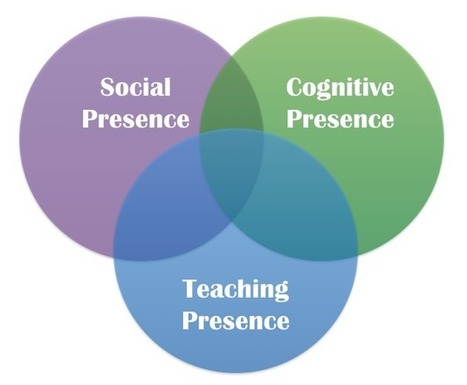
Humanized learning increases the relevance of content and improves students' motivation to log-in week-after-week. When students relate to an online instructor as something more than a subject matter expert and begin to conceive of themselves as part of a larger community, they are more likely to be motivated, be satisfied with their learning, and succeed in achieving the course objectives (Picciano, 2002; Rovai & Barnum, 2003; Richardson & Swan, 2003). Via Bruno De Lièvre

Daniel Collins's curator insight,
July 10, 2017 12:15 AM
An infographic with some great ideas the online teacher can try with their courses.
Infographics are used heavily in just about every niche now, and vary from deadly boring to downright amazing. Via Jeff Domansky
Jeff Domansky's curator insight,
August 20, 2016 11:58 PM
Tips to help you produce a better infographic.
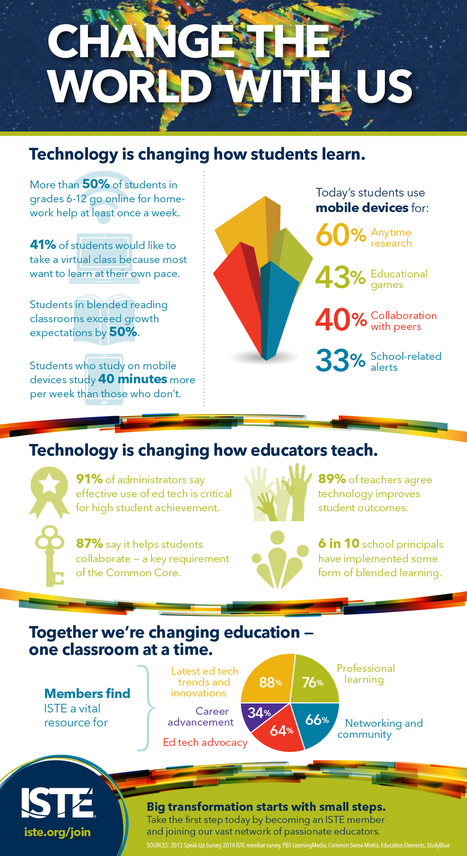
Educational technology is making a huge impact on how students learn, how teachers teach and how education is done.

SA Fia Z's curator insight,
September 29, 2015 4:15 AM
Technology is and will continue to revolutionize education. I 
Tom Georgiev's curator insight,
September 29, 2015 5:18 PM
Lets Change The World Together , I'll Show You How to Make Things Right Again, Gain Trust and Fix any Problems We Face! Give Me Your Hand and Trust Me!
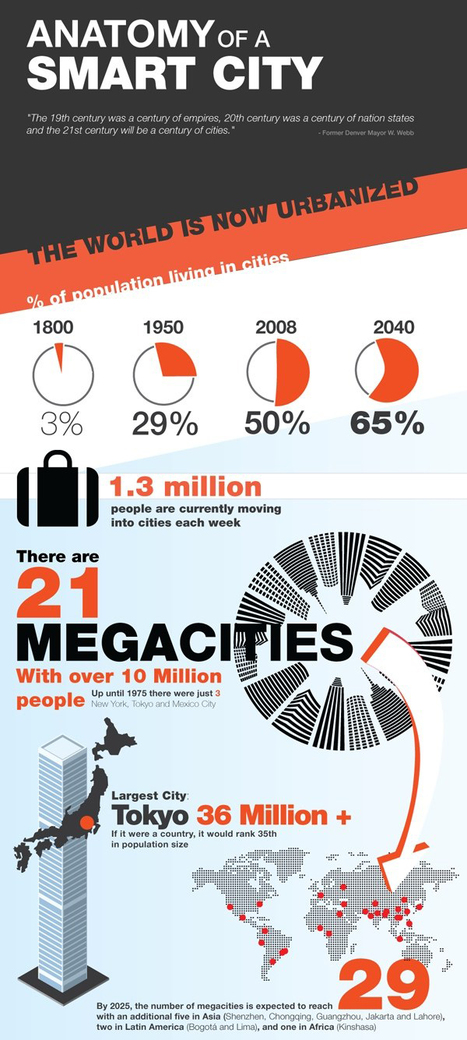
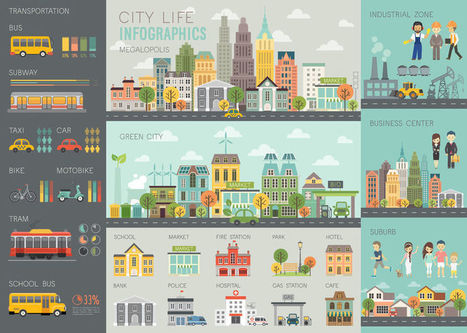
The 19th century was a century of empires, 20th century was a century of nation states and the 21st century will be a century of cities... This outstanding infographic (courtesy of postscapes.com) begins with some information about our current state of urbanization. Did you know that 1.3 million people are moving to cities each week?! It then explains the need for smart cities and delves into what is required to establish these intelligent connected environments, how the smart city may take various forms in the developing worlds and what specific technologies are necessary to achieve such grand goals in practice. Via Lauren Moss

luiy's curator insight,
December 18, 2014 4:31 AM
We have been grateful to the wide array of planners, architects, techies, entrepreneurs and students of the built environment who have joined us on this journey. And the ‘Smart City‘ has featured again and again, whether it be a futurologist’s insights into the bionic, nature-centric adaptable cities of the future, or an economist’s keen ideas on instilling happiness in the built environment. 
Eli Levine's curator insight,
December 18, 2014 10:45 AM
There is an evolution taking place where politics, policy, technology, the environment, and the economy all intersect. This movement towards technical, empirically driven local policy making could be our saving grace.This could be the future of government. |